4 Data Wrangling
This week our goals are to be able to:
- Use the dplyr package to perform basic data transformation and analysis
- Filter and arrange rows of datasets
- Create new columns with
mutate - Select columns
- Use pipes to make our code more readable
- Summarize data by groups using
summarize
4.1 Connection to previous work on Data Organization
This week, we will finally see why organized data is worth the effort. We’ll follow an exercise using a data source with over 300,000 rows! The work this week will show us (1) why R is awesome and fast for analysis, and (2) reinforce the purpose of organized data (following the 12 best practices we learned in Week 1).
Because we are dealing with large datasets now, make sure that your Problem Set does not include pages and pages of data by just showing the top of the final result using head(dataset)
4.2 Source
This exercise follows along with the reading for this week R for Data Science Chapter 3 https://r4ds.hadley.nz/data-transform (this was chapter 5 in the old version https://r4ds.had.co.nz/transform.html, hopefully I’ve updated everything but incase I haven’t there’s the link). The template below is for you to be able to follow along in the reading and complete the exercises.
4.3 3.1 Introduction - Example dataset nycflights13
I’ve gone ahead and installed the 2 packages, but you need to load them into the environment using:
## ── Attaching core tidyverse packages ──────────────────────── tidyverse 2.0.0 ──
## ✔ dplyr     1.1.4     ✔ readr     2.1.6
## ✔ forcats   1.0.1     ✔ stringr   1.6.0
## ✔ ggplot2   4.0.1     ✔ tibble    3.3.1
## ✔ lubridate 1.9.4     ✔ tidyr     1.3.2
## ✔ purrr     1.2.1
## ── Conflicts ────────────────────────────────────────── tidyverse_conflicts() ──
## ✖ dplyr::filter() masks stats::filter()
## ✖ dplyr::lag()    masks stats::lag()
## ℹ Use the conflicted package (<http://conflicted.r-lib.org/>) to force all conflicts to become errors
Why is it important to do this? When you are creating code, explicitly turning on packages that are required is considered good practice. This goes along with the importance of being intentional and making your code reproducible by anyone, anywhere. Tell the computer what to do…explicitly! Tell everyone explicitly what you have done to get to your results.
This also keeps your R sessions memory low and prevents duplicate functions from being loaded from different packages. Notice above when we load tidyverse we get the message that ✖ dplyr::filter() masks stats::filter() and ✖ dplyr::lag() masks stats::lag(), that is because the stats package also has filter and lag functions as well as the dplyr package which is part of the tidyverse package. The tidyverse is actually a package of packages including ggplot2, purrr, tibble, dplyr, tidyr, stringr, readr, and forcats (and maybe more since writing this). We will learn more about all of these in coming weeks. In our case, because we more recently loaded tidyverse if we call filter(some_argument...) this will run the tidyverse/dplyr version of the function. As it says in the reading, if you want to use the base, or stats, version of these functions after loading dplyr, you’ll need to specify the package that the function comes from using two colons :: as in stats::filter() and stats::lag().
4.4 3.1.2
Run flights in the code chunk below. The output should match the reading. Note that you can find a nice README/data dictionary/documentation of this dataset by viewing its help documentation ?flights.
## # A tibble: 336,776 × 19
##     year month   day dep_time sched_dep_time dep_delay arr_time sched_arr_time
##    <int> <int> <int>    <int>          <int>     <dbl>    <int>          <int>
##  1  2013     1     1      517            515         2      830            819
##  2  2013     1     1      533            529         4      850            830
##  3  2013     1     1      542            540         2      923            850
##  4  2013     1     1      544            545        -1     1004           1022
##  5  2013     1     1      554            600        -6      812            837
##  6  2013     1     1      554            558        -4      740            728
##  7  2013     1     1      555            600        -5      913            854
##  8  2013     1     1      557            600        -3      709            723
##  9  2013     1     1      557            600        -3      838            846
## 10  2013     1     1      558            600        -2      753            745
## # ℹ 336,766 more rows
## # ℹ 11 more variables: arr_delay <dbl>, carrier <chr>, flight <int>,
## #   tailnum <chr>, origin <chr>, dest <chr>, air_time <dbl>, distance <dbl>,
## #   hour <dbl>, minute <dbl>, time_hour <dttm>
As described, flights is a data frame called a tibble. What does int mean on the third line of the table? Or dbl?
These are types of variables. Be sure to familiarize yourself with the various types as you move forward, so focus on this section in the reading. You can also check out Vectors and data types in Data Carpentry.
4.5 3.1.3 dplyr basics
https://r4ds.hadley.nz/data-transform#dplyr-basics
Most of the tidyverse aims to make programming make “grammatical” sense in that it is easy to read, understand, and talk about using typical language. One of the really tricky parts of many programming languages including R that you have already experienced is how nested accessors (like [] and $) combined with functions and logical statements are used to do operations on parts of datasets (like finding the mean of certain columns from certain rows). This can make reading a line of code really difficult. You have to read the code from the inside out. For example, from last week, we can run from inside to out.
## [1] 0.3333333## [1] 1 NA 1## [1] FALSE TRUE FALSE## [1] 0.3333333From the dplyr homepage: “dplyr is a grammar of data manipulation, providing a consistent set of verbs that help you solve the most common data manipulation challenges” where verbs are functions that operate on nouns, which are your dataset and elements within it.
For all dplyr “verbs”:
The first argument is always a data frame.
The subsequent arguments typically describe which columns to operate on, using the variable names (without quotes).
The output is always a new data frame.
Direct from R4DS: “Because each verb does one thing well, solving complex problems will usually require combining multiple verbs, and we’ll do so with the pipe, |>. We’ll discuss the pipe more in Section 3.4, but in brief, the pipe takes the thing on its left and passes it along to the function on its right so that x |> f(y) is equivalent to f(x, y), and x |> f(y) |> g(z) is equivalent to g(f(x, y), z). The easiest way to pronounce the pipe is “then”. That makes it possible to get a sense of the following code even though you haven’t yet learned the details:
flights |>
  filter(dest == "IAH") |>
  group_by(year, month, day) |>
  summarize(
    arr_delay = mean(arr_delay, na.rm = TRUE)
  )
## `summarise()` has grouped output by 'year', 'month'. You can override using the
## `.groups` argument.## # A tibble: 365 × 4
## # Groups: year, month [12]
## year month day arr_delay
## <int> <int> <int> <dbl>
## 1 2013 1 1 17.8
## 2 2013 1 2 7
## 3 2013 1 3 18.3
## 4 2013 1 4 -3.2
## 5 2013 1 5 20.2
## 6 2013 1 6 9.28
## 7 2013 1 7 -7.74
## 8 2013 1 8 7.79
## 9 2013 1 9 18.1
## 10 2013 1 10 6.68
## # ℹ 355 more rowsdplyr’s verbs are organized into four groups based on what they operate on: rows, columns, groups, or tables. In the following sections you’ll learn the most important verbs for rows, columns, and groups, then we’ll come back to the join verbs that work on tables in Chapter 19. Let’s dive in!”
4.6 3.2 Row-wise functions
4.6.1 3.2.1 filter()
The example filters the data based on month and day. jan1 <- filter(flights, month == 1, day == 1)
The double-equals ==sign implies “is equal to”; in the filter function above, all flights on the first day of January are saved as a new variable jan1.
What is happening in the command below?
## # A tibble: 27,004 × 19
##     year month   day dep_time sched_dep_time dep_delay arr_time sched_arr_time
##    <int> <int> <int>    <int>          <int>     <dbl>    <int>          <int>
##  1  2013     1     1      517            515         2      830            819
##  2  2013     1     1      533            529         4      850            830
##  3  2013     1     1      542            540         2      923            850
##  4  2013     1     1      544            545        -1     1004           1022
##  5  2013     1     1      554            600        -6      812            837
##  6  2013     1     1      554            558        -4      740            728
##  7  2013     1     1      555            600        -5      913            854
##  8  2013     1     1      557            600        -3      709            723
##  9  2013     1     1      557            600        -3      838            846
## 10  2013     1     1      558            600        -2      753            745
## # ℹ 26,994 more rows
## # ℹ 11 more variables: arr_delay <dbl>, carrier <chr>, flight <int>,
## #   tailnum <chr>, origin <chr>, dest <chr>, air_time <dbl>, distance <dbl>,
## #   hour <dbl>, minute <dbl>, time_hour <dttm>
The reading also points out the use of the near function. Why is this important? Illustrate the example below in the code chunk below to reinforce the concept.
Paste sqrt(1.9999999999999999999999)^2 in the code chunk and run it. If you keep removing the trailing 9s, when does the result not equal 2? What happens when you run sqrt(2)^2==2? Show me that you can have the computer make these equivalent using near(), and explain in one word—yes one word—the result of sqrt(2)^2==2 versus using the near function. (Hint: the word starts with P).
4.6.1.1 Logical Operators
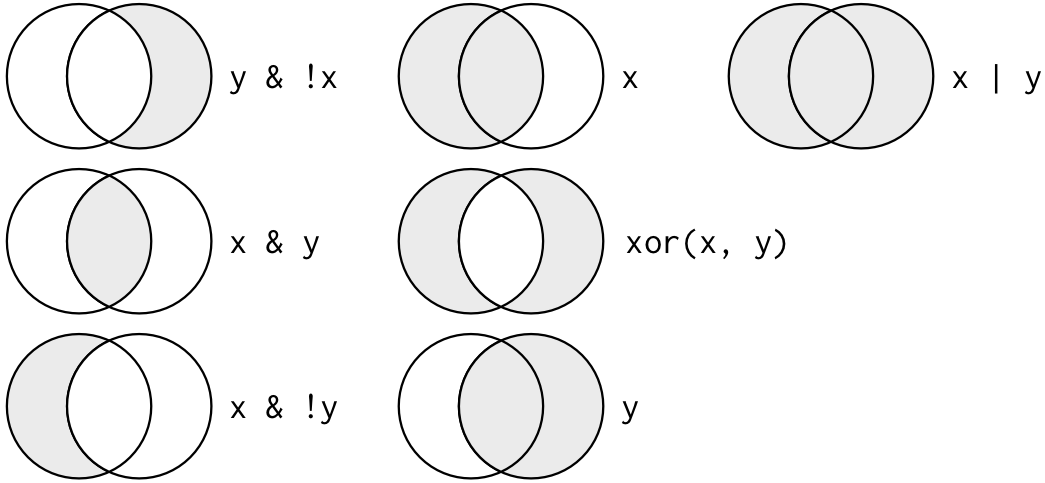
We learned about ==, “is equal to,” above. Other logical or Boolean operators that can be used as filters are >, ==, <, <=, != (not equal). You can also combine these with other Logical or Boolean operators: & (and), | (or), and ! (not).
x
## [1] TRUE TRUE TRUE FALSEHow would you select all flights in May and June?
## # A tibble: 57,039 × 19
##     year month   day dep_time sched_dep_time dep_delay arr_time sched_arr_time
##    <int> <int> <int>    <int>          <int>     <dbl>    <int>          <int>
##  1  2013     5     1        9           1655       434      308           2020
##  2  2013     5     1      451            500        -9      641            640
##  3  2013     5     1      537            540        -3      836            840
##  4  2013     5     1      544            545        -1      818            827
##  5  2013     5     1      548            600       -12      831            854
##  6  2013     5     1      549            600       -11      804            810
##  7  2013     5     1      553            600        -7      700            712
##  8  2013     5     1      553            600        -7      655            701
##  9  2013     5     1      554            600        -6      731            756
## 10  2013     5     1      554            600        -6      707            725
## # ℹ 57,029 more rows
## # ℹ 11 more variables: arr_delay <dbl>, carrier <chr>, flight <int>,
## #   tailnum <chr>, origin <chr>, dest <chr>, air_time <dbl>, distance <dbl>,
## # hour <dbl>, minute <dbl>, time_hour <dttm>## [1] 28796## [1] 28243## [1] 57039## [1] 28520## [1] 57039R also has another nifty logical operator %in%, which searches for a matches of one vector in another and return true for any matching values. So for example:
##  [1]  TRUE  TRUE FALSE FALSE FALSE FALSE FALSE FALSE FALSE FALSE FALSE FALSE
## [13] FALSE FALSE FALSE FALSE FALSE FALSE FALSE FALSE FALSE FALSE FALSE FALSE
## [25] FALSE  TRUE
So we could select all flights in May and June using this now.
## # A tibble: 100 × 19
##     year month   day dep_time sched_dep_time dep_delay arr_time sched_arr_time
##    <int> <int> <int>    <int>          <int>     <dbl>    <int>          <int>
##  1  2013     6    30     2334           1836       298       50           2015
##  2  2013     6    30     2336           2029       187      231           2359
##  3  2013     6    30     2343           2029       194      205           2303
##  4  2013     6    30     2345           2146       119      229             30
##  5  2013     6    30     2347           2125       142      105           2253
##  6  2013     6    30     2348           2130       138      229             14
##  7  2013     6    30     2354           2245        69       53           2359
##  8  2013     6    30     2354           2245        69      117              1
##  9  2013     6    30     2357           2112       165      223           2359
## 10  2013     6    30     2358           2225        93       49           2330
## # ℹ 90 more rows
## # ℹ 11 more variables: arr_delay <dbl>, carrier <chr>, flight <int>,
## #   tailnum <chr>, origin <chr>, dest <chr>, air_time <dbl>, distance <dbl>,
## # hour <dbl>, minute <dbl>, time_hour <dttm>4.6.2 3.2.3 Arranging rows
We can arrange rows by a particular columns values using arrange. For example with the flights dataset we could arrange by departure time.
## # A tibble: 336,776 × 19
##     year month   day dep_time sched_dep_time dep_delay arr_time sched_arr_time
##    <int> <int> <int>    <int>          <int>     <dbl>    <int>          <int>
##  1  2013     1    13        1           2249        72      108           2357
##  2  2013     1    31        1           2100       181      124           2225
##  3  2013    11    13        1           2359         2      442            440
##  4  2013    12    16        1           2359         2      447            437
##  5  2013    12    20        1           2359         2      430            440
##  6  2013    12    26        1           2359         2      437            440
##  7  2013    12    30        1           2359         2      441            437
##  8  2013     2    11        1           2100       181      111           2225
##  9  2013     2    24        1           2245        76      121           2354
## 10  2013     3     8        1           2355         6      431            440
## # ℹ 336,766 more rows
## # ℹ 11 more variables: arr_delay <dbl>, carrier <chr>, flight <int>,
## #   tailnum <chr>, origin <chr>, dest <chr>, air_time <dbl>, distance <dbl>,
## #   hour <dbl>, minute <dbl>, time_hour <dttm>
By default arrange sorts the rows from low to high on the variable you pass. To sort high to low you put a - in front of the variable or use desc(variable).
## # A tibble: 336,776 × 19
##     year month   day dep_time sched_dep_time dep_delay arr_time sched_arr_time
##    <int> <int> <int>    <int>          <int>     <dbl>    <int>          <int>
##  1  2013    10    30     2400           2359         1      327            337
##  2  2013    11    27     2400           2359         1      515            445
##  3  2013    12     5     2400           2359         1      427            440
##  4  2013    12     9     2400           2359         1      432            440
##  5  2013    12     9     2400           2250        70       59           2356
##  6  2013    12    13     2400           2359         1      432            440
##  7  2013    12    19     2400           2359         1      434            440
##  8  2013    12    29     2400           1700       420      302           2025
##  9  2013     2     7     2400           2359         1      432            436
## 10  2013     2     7     2400           2359         1      443            444
## # ℹ 336,766 more rows
## # ℹ 11 more variables: arr_delay <dbl>, carrier <chr>, flight <int>,
## #   tailnum <chr>, origin <chr>, dest <chr>, air_time <dbl>, distance <dbl>,
## #   hour <dbl>, minute <dbl>, time_hour <dttm>
This may seem a little awkward, but it allows you to easily provide multiple variable names for a complex sort.
## # A tibble: 336,776 × 19
##     year month   day dep_time sched_dep_time dep_delay arr_time sched_arr_time
##    <int> <int> <int>    <int>          <int>     <dbl>    <int>          <int>
##  1  2013    12    29     2400           1700       420      302           2025
##  2  2013     7     7     2400           1950       250      107           2130
##  3  2013     9    12     2400           2000       240      203           2230
##  4  2013     7    28     2400           2059       181      247           2322
##  5  2013     2    11     2400           2135       145      251             35
##  6  2013     7    17     2400           2142       138       54           2259
##  7  2013     6    17     2400           2145       135      102           2315
##  8  2013     7    13     2400           2155       125      225             43
##  9  2013     7    13     2400           2245        75      101           2359
## 10  2013     8    10     2400           2245        75      110              1
## # ℹ 336,766 more rows
## # ℹ 11 more variables: arr_delay <dbl>, carrier <chr>, flight <int>,
## #   tailnum <chr>, origin <chr>, dest <chr>, air_time <dbl>, distance <dbl>,
## #   hour <dbl>, minute <dbl>, time_hour <dttm>
4.7 3.3 Columns
4.7.1 3.3.1 Mutate - Add new variables
The function mutate is used to add new variables/columns to a data frame.
Following the example at the beginning of section 5.5 in the book, add a new speed variable using mutate to your data frame.
flights_sml <- select(flights,
  year:day,
  ends_with("delay"),
  distance,
  air_time
)

#add a speed variable
Next, pay attention to the Useful transformation functions and the modular arithmetic section to obtain hour and minutes from the departure data. Try for yourself below. This is pretty cool and can be useful.
4.7.2 3.3.2 Select
It’s not uncommon to get datasets with hundreds or even thousands of variables. In this case, the first challenge is often narrowing in on the variables you’re actually interested in. select() allows you to rapidly zoom in on a useful subset using operations based on the names of the variables.
select() is not terribly useful with the flights data because we only have 19 variables, but you can still get the general idea:
## # A tibble: 336,776 × 3
##     year month   day
##    <int> <int> <int>
##  1  2013     1     1
##  2  2013     1     1
##  3  2013     1     1
##  4  2013     1     1
##  5  2013     1     1
##  6  2013     1     1
##  7  2013     1     1
##  8  2013     1     1
##  9  2013     1     1
## 10  2013     1     1
## # ℹ 336,766 more rows
4.8 3.4 The pipe
The pipe operator, which I’ve demonstrated just a few times above, is really fantastically justified by the The pipe section. I would definitely recommend reading this short section.
The idea of piping is that it can make it easier to write, follow, and understand what the commands are doing. Think of each pipe command as “then”. The pipe command uses the following syntax : |>. What it essentially does is take the result of the code on the left-hand side or previous line(s) and pass it as the first argument to the function on the right-hand side.
We can recreate the example above with pipes. Written in words the code chunk below would be: ASSIGN a new object name,
CHOOSE the dataset to operate on, THEN
arrange the dataset by longest distance, THEN
filter the December flights, THEN
select the flight number, departure delay, and carrier columns.
4.9 3.5 Groups
Grouped summaries are essentially what pivot tables are in Excel, if you have ever heard of those. By using the summarise() function with the group_by function we can, for example find the average flight delay by month. This becomes really awesome! This example starts with using group_by to group the data, then applies summarise.
## # A tibble: 12 × 2
##    month delay
##    <int> <dbl>
##  1     1 10.0
##  2     2 10.8
##  3     3 13.2
##  4     4 13.9
##  5     5 13.0
##  6     6 20.8
##  7     7 21.7
##  8     8 12.6
##  9     9  6.72
## 10    10  6.24
## 11    11  5.44
## 12    12 16.6
Next week we’ll practice summarizing data a lot more as well as “pivoting” our data, which is We’ll get to making those sweet, sweet plots soon.